


 Deciding where to send your child to school can be a daunting task. Parents need to think carefully about what is most important to them when it comes to their child’s education.
Now, parents have a convenient way to access detailed information on public schools across the state. In March 2017, the California Department of Education piloted a new website with measurements to show how public schools are performing on a variety of factors based on California’s new school accountability system. The online tool, called the California School Dashboard, is fully operational for the 2017-18 school year and is available at www.caschooldashboard.org.
The California State Board of Education (SBE) developed the system, modeled after a system in Alberta, Canada, to help parents, educators and the public evaluate schools and districts, identify strengths and weaknesses and provide targeted assistance. The board gathered input from parents, schools and advocacy groups across the state to create this new window into school and district performance in an attempt to offer a more complete picture of how schools are meeting students’ needs. The first-phase rollout allowed people to become familiar with the website and provide feedback on the dashboard reports and functionality. The dashboard has come out of beta testing for this school year, but there will be continued adjustments and improvements going forward as needed.

Unlike its predecessor, the Academic Performance Index (API), the California School Dashboard does not rank schools from high to low. The dashboard is instead designed to help parents think about schools in a different, broader way by giving a whole picture of the school. This accountability system isn’t just about academics. It also takes into account suspension rate, graduation rate, parent engagement and implementation of academic standards.
“The California School Dashboard will be far more useful to parents and the public than the previous API, which relied solely on test scores to produce one number for each school,” says Robert Oakes, assistant director of communications at the California Department of Education. “We use multiple ways to make big decisions when buying a house or a car, so why should choosing a school be any different? We look online, do research and gather information on multiple factors. This new accountability system reflects the progress schools are making, just like how a dashboard on a car gives a driver multiple sources of information, like speed, fuel, traction control and so on.”
There are three important advantages to California’s new approach.
- More than a single number — The multiple measures of student success define a quality education more broadly than a single test score. This new color-coded system identifies how schools are doing, where they need to improve and how to get better.
- Drives for equity — There is an increased focus on identifying and addressing disparities among student groups.
- Supports local decision making — State accountability tools provide information to support the local planning process to improve student performance.
“Everyone will benefit by having so much readily available information about the performance of schools and districts in all of the elements needed to create a successful, positive learning environment,” says Oakes.
The dashboard is made up of easy-to-use reports that show local school and educational agency (e.g., county offices of education, charter schools, alternative high schools, schools inside county juvenile facilities) performance on six state indicators and four local indicators. Reports include student performance on standardized tests in English and math, suspension and graduation rates, and English as a Second Language (ESL) progress toward proficiency. Digging deeper into the data reveals how specific groups of students are doing in these areas.

A school receives a color for each area of the dashboard, on a scale from red as worst to blue as best. However, schools do not receive overall colors.
The information for the dashboard comes from a combination of sources. Some of the content comes from computer-based systems that take school attendance. Other information comes from Advance Placement (AP) tests and other standardized tests where student scores are reported directly from the testing companies. Local information is also sent straight from the district and the schools themselves. This information is more narrative than the attendance numbers and test scores, and it gives as accurate a picture of school life as the teachers and administrators of the schools themselves can report.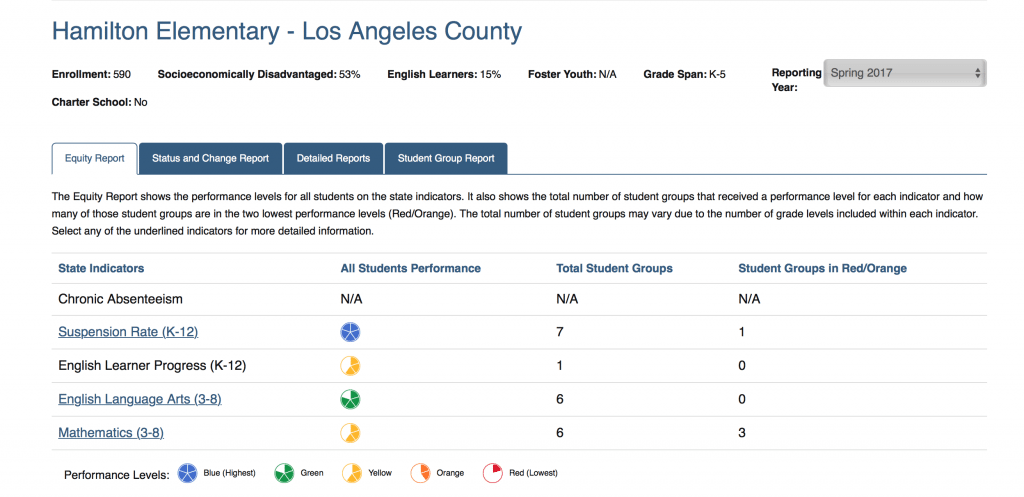
“The system has been two to three years in the making, but it’s not finalized yet,” says Carlye Marousek Olsen, director of accountability, staff development, and curriculum and instructional materials for the Whittier Union High School District. “The goal is to have three years of past data to compare growth and illustrate a more stable rate. The Alberta model has that, and we’re building up to it.” With the pilot complete and the first year of the new accountability system now underway, the data will continue to become more informative as the years go by.
Wondering what to watch out for with this tool? For starters, it’s not all-inclusive.

In some cases, the colorful “slices of pie” on the dashboard don’t tell the whole story about what’s happening at a school. “I recommend considering all of the indicators,” says Ethan Stocks, curriculum coordinator for Temple City Unified School District. “I would look at the district-level data as well as the reports for each of the school sites that my child would attend over the course of his or her educational career.”
It’s also important to remember that this new dashboard is not a ranking system, and so requires a little more thought on the part of the user. “When parents are looking for a school, they should examine what their values are and what they really want in a school,” says Olsen. “Then they can search for a school that meets what they’re looking for that way.”
A criticism of the new dashboard is that it is overly complex. The old API may have been crude, but it was more straightforward and easier to read. However, dashboard proponents say the new system is worth the extra effort.
“I would encourage parents to familiarize themselves with the dashboard before drawing conclusions about a school’s performance,” says Stocks. “It’s a tool that takes some getting used to and definitely rewards repeat viewing. I still notice new features and information almost every time I log in. When stakeholders are used to the dashboard and comfortable with all its bells and whistles, I believe they will have a better understanding of school and district performance.”

https://www.youtube.com/watch?v=h5JUHzcb99I
And if, after spending some time on the dashboard, you don’t understand what you’re seeing, you can always speak to a school or district administrator to get more information.
For parents evaluating public and private schools, experts suggest asking any private school under consideration to provide the same information included in the public school dashboard for an apples-to-apples comparison. “Any failure or inability to do so would be a major red flag to me,” noted Stocks.
The dashboard is being updated continually. This fall, additional indicators, such as chronic absenteeism, are being added, as well as more current information about the indicators that are already available. District data on local indicators will also be added for the first time. Eventually, a measure of college readiness will be added as well.

Additional upcoming features will include a mobile design for smartphone and tablet users, printer-friendly PDFs and a revised search function. Updated versions of the dashboard will be published each fall and will incorporate the most recent available data.
The idea is that the system will improve as time goes on, making it easy for stakeholders to see what factors shape a school’s success and how a school has performed — for better or worse — on each of those measures over time. The goal is a much more transparent accountability system than the old API.
For a helpful list of frequently asked questions, visit the dashboard website at: www.caschooldashboard.org/#/faq.
Christina Thompson is a local writer and L.A. mom.